

Europe ex-UK Value Update

Among global investors today, there is a growing sense of unease that markets are overvalued, with the MSCI All Country World Index trading at over 18x forward earnings (94th percentile)1 while global bond yields have been marching higher. As such, the market’s equity risk premium is once again disappearing before investors’ eyes. The global market, however, has become heavily influenced by an ever-growing U.S. weighting, which itself is a function of a handful of massive—and expensive—U.S. tech companies. Europe, on the other hand, has become somewhat of an epicenter of investor pessimism, resulting in a large and diverse subset of fundamentally strong businesses trading at highly discounted valuations today.
THE EUROPEAN DISCOUNT
Europe has been contending with a host of macroeconomic headwinds in recent months, none of which are without precedent and all of which have the potential to reverse, or at least improve, over time. These include
- a reduction in trade with China, which is in the midst of its own economic downturn. China is a vital market for European manufacturers; with Chinese consumers under pressure, imports from Europe have declined to €216bn from a high of €233bn in April 20232.
- the ongoing war in Ukraine, which is approaching its third year, and associated fears of another energy crisis.
- political turmoil in France and Germany, resulting in fiscal policy uncertainty.
- the threat of renewed U.S. import tariffs from the Trump Administration, which have the potential to further erode European exporters’ revenue streams.
- anemic economic growth against a backdrop of lingering inflation and high fiscal deficits, particularly in France. Combined with a selloff in U.S. treasuries, which European sovereign debt tends to mirror, this has prompted a rise in long-term bond yields and raised borrowing costs for businesses and governments across the region.
MACRO FEARS BREED OPPORTUNITY IN SPECIFIC STOCK SELECTION
Each of the above-mentioned headwinds could have real financial implications for European-domiciled businesses if they persist or worsen. But given the MSCI Europe ex-UK Index’s 14.4x forward multiple3, investors have already priced in much of the negativity.
More importantly, we stress that macroeconomic direction and corporate earnings—which stock prices track over time—are not inextricably linked (Exhibit 1). Individual businesses are exposed to a variety of factors outside of basic economic growth, and our investment process is designed to uncover companies that are temporarily under-earning for largely idiosyncratic reasons. Thus, we view individual stocks that have sold off because of country-specific macro fears as potentially exploitable value opportunities. A prime example of this is our collective French exposure, which consists of eight multinationals (Exhibit 2) that generate about 66% of their revenue, on average, outside of the EU. Despite doing much of their business outside France, their shares declined 8.6% on average from early June 2024 when France’s political and fiscal woes made headlines following EU parliamentary elections4, underperforming the broader MSCI Europe Index, which was up roughly one percent over the same period.
Exhibit 1
Correlation Between Year-Over-Year Nominal GDP Growth
and Corporate EPS Growth5

Source: FactSet, MSCI indicies, (table includes five largest countries in MSCI Europe ex UK Index)
Exhibit 2
Pzena Europe ex UK Portfolio’s French Holdings
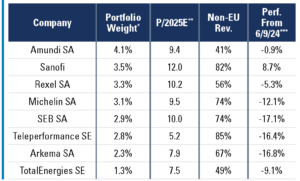
Source: FactSet, Pzena analysis, defined as Country of Headquarters
*As of Dec. 31st, 2024
**FactSet, PE FY1 as of 1/21/25
**Stock total returns in EUR, 6/9/24 – 1/21/25. For Full portfolio performance please see our FactSheet
EUROPEAN VALUE VS. AMERICAN EXCEPTIONALISM
With the S&P 500 having outpaced Europe in nine of the past 12 years following the Eurozone debt crisis, the choice for asset allocators seems simple enough: keep doing what has been working. It is well known that eight mega-cap U.S. tech companies—and their superb earnings growth—have been largely responsible for the S&P’s dominance in recent years; what is perhaps less understood is how the other 492 companies’ financials compare to their global counterparts. Interestingly, given their exorbitant valuations and massive capex outlays, the BATMMAAN6 cohort is only offering investors a 2.6% expected 2025 free cash flow yield today, well below the S&P 500 average7. Even if we exclude these eight juggernauts at the top of the S&P, our Europe ex-UK portfolio’s average free cash flow yield is roughly double that of the U.S. index (Exhibit 3). A high starting free cash flow yield can provide investors with double-digit returns even assuming modest earnings growth.
Exhibit 3
Expected Free Cash Flow Yields

Source: FactSet, data as of 1/21/25 (only includes companies with estimates available, does not include financial companies).
In continental Europe, depressed sentiment and low expectations have resulted in extremely undemanding valuations. Case in point, our Europe ex-UK portfolio is currently trading at a 9.9x forward earnings multiple8 which, in our view, offers investors an asymmetrical performance outcome that is skewed to the upside.
AN INEXPENSIVE, DIVERSE SET OF BUSINESSES
Our Europe ex-UK portfolio is comprised of 34 distinct businesses, each with a European domicile; however, each company has diverse revenue streams and idiosyncratic risks that are not dependent on Europe-specific factors like GDP growth. These companies range from Italian utility Italgas, which is the largest gas distributor in its domestic market and generates all of its revenue within the EU, to French pharmaceutical giant Sanofi, which counts the U.S. as its single largest market. Overall, our portfolio’s average non-EU sales exposure is 59%9.
In our view, this offers investors somewhat of a geographic arbitrage opportunity; meaning, because of extremely depressed sentiment in Europe, we can own strong businesses with global revenue streams that are heavily discounted simply because of where they are headquartered. As illustrated in Exhibit 4, several of our portfolio companies with direct U.S. peers are trading at historically large discounts to those peers.
Exhibit 4
The U.S. Valuation Premium is Larger Than Usual

Source: FactSet, monthly NTM P/E data
**Exxon/Equinor data excludes CY20 due to XOM’s large asset write-down that artificially depressed its EPS
CONCLUSION
Markets have applied an unusually large discount to European-domiciled companies, which we believe presents skewed performance outcomes—particularly for businesses that are not completely reliant on Europe for their long-term profitability. While the world is filled with uncertainty, it is precisely this lack of clarity and consensus that provides opportunities when reflected in valuations.
Footnotes
- FactSet, P/E – NTM, monthly data 12/31/04-1/21/25
- FactSet, China + Hong Kong, TTM as of October 2024
- FactSet, P/E NTM as of 1/21/25
- Simple average of total returns in EUR, 6/9/24-1/21/25
- Quarterly data from Dec. 2004-Sept. 2024
- Broadcom, Amazon, Tesla, Microsoft, Meta, Apple, Alphabet, NVIDIA
- FactSet, simple average of FCF yields as of 1/21/25
- FactSet, weighted average of P/2025E as of 1/21/25
- FactSet GeoRev estimates


Further information
This document is intended solely for informational purposes. The views expressed reflect the current views of Pzena Investment Management (“PIM”) as of the date hereof and are subject to change. PIM is a registered investment adviser registered with the United States Securities and Exchange Commission. PIM does not undertake to advise you of any changes in the views expressed herein. There is no guarantee that any projection, forecast, or opinion in this material will be realized. Past performance is not indicative of future results. All investments involve risk, including risk of total loss.
This document does not constitute a current or past recommendation, an offer, or solicitation of an offer to purchase any securities or provide investment advisory services and should not be construed as such. The information contained herein is general in nature and does not constitute legal, tax, or investment advice. PIM does not make any warranty, express or implied, as to the information’s accuracy or completeness. Prospective investors are encouraged to consult their own professional advisers as to the implications of making an investment in any securities or investment advisory services.
All investments involve risk, including loss of principal. The price of equity securities may rise or fall because of economic or political changes or changes in a company’s financial condition, sometimes rapidly or unpredictably. Investments in foreign securities involve political, economic and currency risks, greater volatility and differences in accounting methods. These risks are greater for investments in Emerging Markets. Investments in small-cap or mid-cap companies involve additional risks such as limited liquidity and greater volatility than larger companies. PIM’s strategies emphasize a “value” style of investing, which targets undervalued companies with characteristics for improved valuations. This style of investing is subject to the risk that the valuations never improve or that returns on “value” securities may not move in tandem with the returns on other styles of investing or the stock market in general.
The use of hypothetical/projected returns is subject to certain risks and limitations and are presented for illustrative purposes only. They are not indicative of the past or future performance of any current or future investment strategies or funds.
The MSCI Europe ex-UK Index captures large and mid-cap representation across 14 Developed Markets (DM) countries in Europe. With 336 constituents, the index covers approximately 85% of the free float-adjusted market capitalization across European Developed Markets excluding the UK.
The MSCI Europe Index captures large and mid-cap representation across 15 Developed Markets (DM) countries in Europe*. With 414 constituents, the index covers approximately 85% of the free float-adjusted market capitalization across the European Developed Markets equity universe.
The S&P 500® is a registered trademark of Standard & Poor’s, a division of The McGraw Hill Companies, Inc., which is the owner of all copyrights relating to this index and the source of the performance statistics of this index that are referred to herein.
For UK Investors: This marketing communication is issued by Pzena Investment Management, Limited (“PIM UK”). PIM UK is a limited company registered in England and Wales with registered number 09380422, and its registered office is at 34-37 Liverpool Street, London EC2M 7PP, United Kingdom. PIM UK is an appointed representative of Vittoria & Partners LLP (FRN 709710), which is authorised and regulated by the Financial Conduct Authority (“FCA”). The Pzena documents have been approved by Vittoria & Partners LLP and, in the UK, are only made available to professional clients and eligible counterparties as defined by the FCA. Past performance is not indicative of future results. The value of your investment may go down as well as up, and you may not receive upon redemption the full amount of your original investment. The views and statements contained herein are those of Pzena Investment Management and are based on internal research.
For Jersey Investors Only: Consent under the Control of Borrowing (Jersey) Order 1958 (the “COBO” Order) has not been obtained for the circulation of this document. Accordingly, the offer that is the subject of this document may only be made in Jersey where the offer is valid in the United Kingdom or Guernsey and is circulated in Jersey only to persons similar to those to whom, and in a manner similar to that in which, it is for the time being circulated in the United Kingdom, or Guernsey, as the case may be. The directors may, but are not obliged to, apply for such consent in the future. The services and/or products discussed herein are only suitable for sophisticated investors who understand the risks involved. Neither Pzena Investment Management, Ltd. nor Pzena Investment Management, LLC nor the activities of any functionary with regard to either Pzena Investment Management, Ltd. or Pzena Investment Management, LLC are subject to the provisions of the Financial Services (Jersey) Law 1998.
For EU Investors Only: This marketing communication is issued by Pzena Investment Management Europe Limited (“PIM Europe”). PIM Europe (No. C457984) is authorised and regulated by the Central Bank of Ireland as a UCITS management company (pursuant to the European Communities (Undertakings for Collective Investment in Transferable Securities) Regulations, 2011, as amended). PIM Europe is registered in Ireland with the Companies Registration Office (No. 699811), with its registered office at Riverside One, Sir John Rogerson’s Quay, Dublin, 2, Ireland. Past performance is not indicative of future results. The value of your investment may go down as well as up, and you may not receive upon redemption the full amount of your original investment. The views and statements contained herein are those of Pzena Investment Management and are based on internal research.
For Australia and New Zealand Investors Only: This document has been prepared and issued by Pzena Investment Management, LLC (ARBN 108 743 415), a limited liability company (“Pzena”). Pzena is regulated by the Securities and Exchange Commission (SEC) under U.S. laws, which differ from Australian laws. Pzena is exempt from the requirement to hold an Australian financial services license in Australia in accordance withASICClass Order CO 03/1100 and the transitional relief under ASIC Corporations (Repeal and Transitional) Instrument 2016/396, extended through 31 March 2026 by ASIC Corporations (Amendment) Instrument 2024/497. Pzena offers financial services in Australia to ‘wholesale clients’ only pursuant to that exemption. This document is not intended to be distributed or passed on, directly or indirectly, to any other class of persons in Australia.
In New Zealand, any offer is limited to ‘wholesale investors’ within the meaning of clause 3(2) of Schedule 1 of the Financial Markets Conduct Act 2013 (‘FMCA’). This document is not to be treated as an offer, and is not capable of acceptance by, any person in New Zealand who is not a Wholesale Investor.
© Pzena Investment Management, LLC, 2025. All rights reserved.