

Analyzing Biodiversity

Biodiversity Defined
What is biodiversity?
Biodiversity includes three components:
- Species diversity: variety of living organisms
- Genetic diversity: variety in genetic characteristics and traits of populations
- Ecosystem diversity: variety of species in a region
Primary drivers of biodiversity loss
Figure 1: The five drivers of biodiversity decline
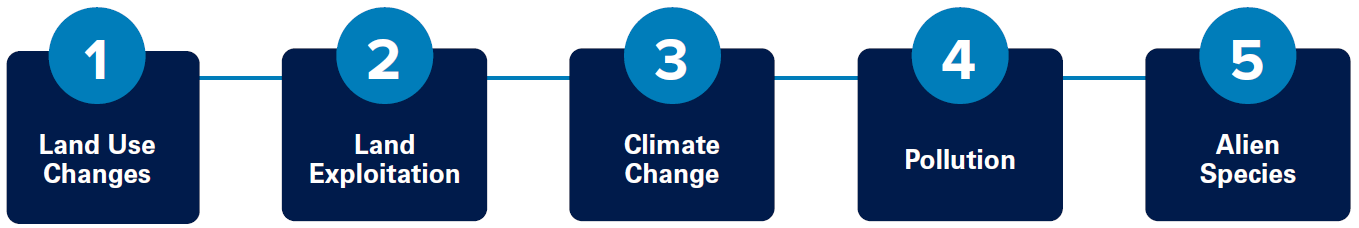 Source: Barclays Research
Measuring biodiversity
- Valuation requires data and measurement. While pollution, water, and GHGs can be measured for climate change, biodiversity is more complex to distill down to a single metric.
- Mean Species Abundance (MSA) is increasingly talked about as a possible comparable metric for biodiversity.
- MSA is an indicator of the extent to which biodiversity is intact in a given area.
- It is defined as the mean abundance of original species in the area in question relative to their abundance in undisturbed ecosystems.
- MSA scores are expressed in MSA.km ² and range from 0 to 1, with a score of 1 indicating fully intact biodiversity and 0 indicating that all original species are extinct; i.e., the closer the score is to 1, the less the company’s impact on biodiversity.
- MSA has its flaws as a single metric:
- Difficult to calculate and isolate to a specific company
- Many underlying assumptions that diminish overall accuracy;
- Does not consider other aspects of biodiversity such as genetic biodiversity;
- Industry-specific metrics are more relevant for individual companies;
- ‘Abundance’ itself is not necessarily always a ‘good’ thing for biodiversity, introducing new species into an ecosystem can also have negative impacts on overall biodiversity
Why does biodiversity matter?
Society
Biodiversity performs several critical functions for society:
- Regulating: natural regulation of global cycle; e.g., clean air/water, fertile soil, climate patterns, barriers to extreme weather
- Material: physical needs; e.g., food, energy, materials to build homes and infrastructure
- Non-material: emotional needs; e.g., inspiration for art or culture, recreation
There is increasing concern over the rate of biodiversity loss:
- Humans – making up just 0.01% of all living creatures, have caused the loss of 83% of known wild animals, and 50% of plants
- Continued rates of ecosystem decline could cost US$9.87 trillion over 2011-2050 (WWF)
- The World Economic Forum’s Global Risk survey report places biodiversity loss as the fourth most significant global risk over the next decade, after climate change and extreme events, but ahead of the debt crises, infectious diseases and geo-economic confrontation
Investors
Biodiversity is increasingly an issue of focus for the investment community. Reasons include the connection between biodiversity and climate change, as well as societal pressure to address biodiversity loss. However, the inability to easily measure and therefore accurately value biodiversity has made it challenging for investors to consider. We feel it may be more helpful to think about this issue at the industry level.
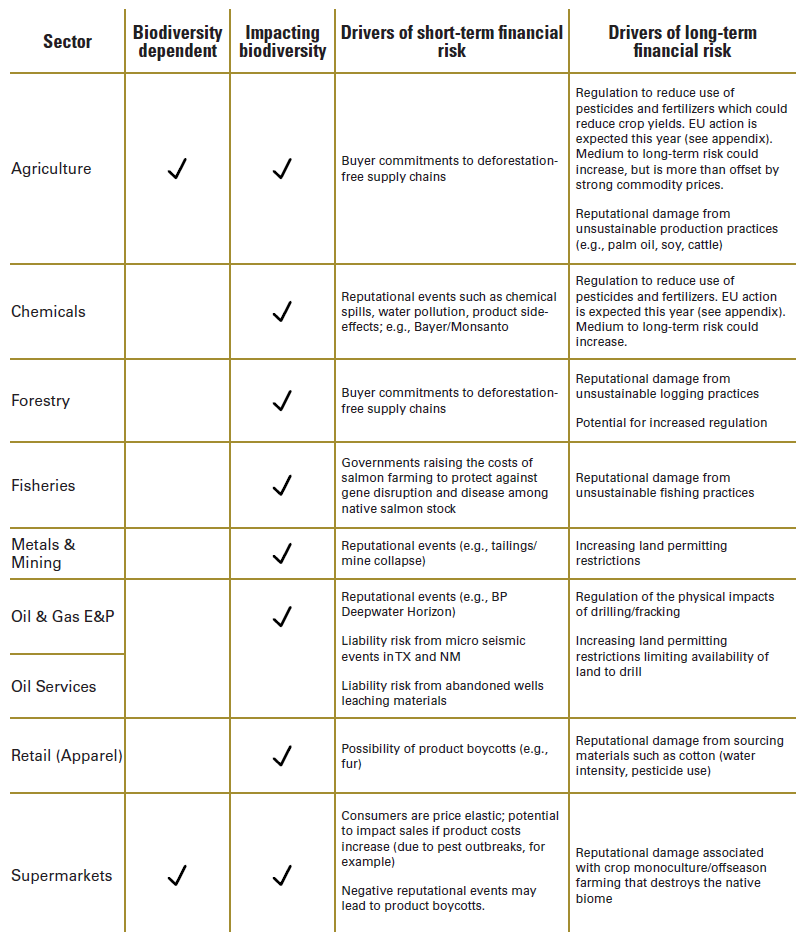
Sector Considerations
Some sectors face financial risk resulting from their dependence on biodiversity and ecosystem services; others face regulatory and reputational risk because of their significant impact on biodiversity. While it is easier to conceptualize the financial risk for the latter, it is not clear that regulation will be a leading indicator of risk. For example, while EU and US authorities have been exploring regulation of PFAS in drinking water, the chemical industry has moved on and adapted its business models. In such a situation, sudden reputational damage is more likely than sudden regulatory change.
It may be helpful to think about two aspects of financial risk:
- Short-term: risk drivers that are more immediately financially material to shareholders
- Long-term: societal/regulatory drivers of risk that can become financially material over time
Engagement Framework
Governance
- Integration of biodiversity into company strategy
- Policies and procedures for operating responsibly in areas of biodiversity (should include supply chain as relevant and go beyond compliance with local laws)
- Organizational accountability (e.g., operations personnel or regional business head)
- Transparency of disclosure (resource management and assessment of any controversies)
- Evidence of collaboration with peers/industry organizations
Risk Identification
- Framework for assessing biodiversity impacts when evaluating projects
- Direct and indirect sensitivity analysis for products/divisions dependent on biodiversity
- Monitoring changing regulations (e.g., EU biodiversity action plan), including assessment of need for alternative ingredients/source regions
- Assessment of consumer awareness/focus and impact on earnings
- Supplier assessments (e.g., standards, audits, site visits), including going beyond Tier 1 suppliers and taking supplier action in cases of transgressions (e.g., deforestation)
Risk Mitigation
- Full supply chain traceability including commodity sourcing (e.g., use of blockchain)
- Use of sustainable sourcing/certification practices (e.g., Palm Oil certified to RSPO criteria)
- Documented KPIs (e.g., tracking MSA as relevant)
- Detailed diligence and remediation processes
- Third-party verification of site audits/policy compliance
Appendix
Appendix 1: Rate of biodiversity loss
Chart 1: Financial and human capital coming at a cost to natural capital
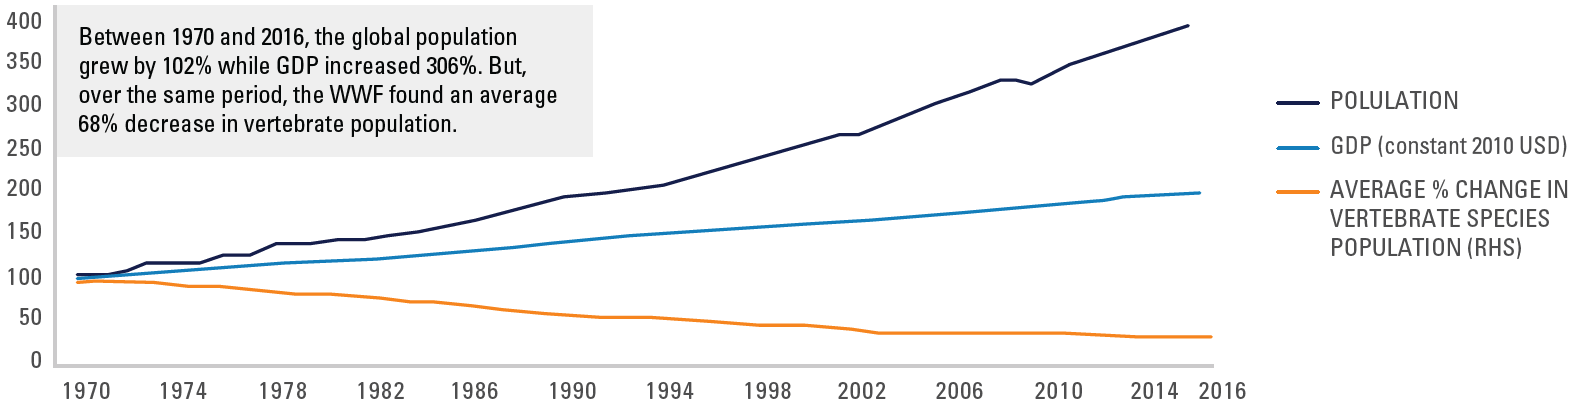
Source: World Bank, Living Planet Index, WWF
Chart 2: Global biodiversity in decline…
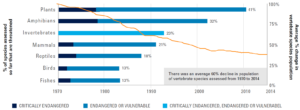
Source: IUCN, WWF Living Planet Index
Appendix 2: Understanding MSA
Chart 3: Computing Mean Species Abundance (MSA)
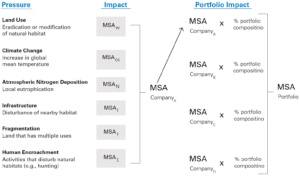 Source: Barclays Research. Note: The specific pressures used may vary by data provider
Appendix 3: Biodiversity Regulation
United Nations
Kunming Declaration 2021
- 2021 agreement (over 100 countries) to put biodiversity and ecosystem protection at the core of political decision-making, and to pave the way for a global biodiversity framework
- Investors may now incorporate the nexus between biodiversity and social risks in their engagement strategies
Cop15 (Kunming April-May 2022)
- Countries expected to adopt the global biodiversity framework in May 2022
- Aims to agree on new 10-year targets as part of the UN’s biodiversity framework
- Expected to include a commitment to protect 30% of land and seas
- Other possible targets are:
- 2/3 reduction in pesticides
- Halving food waste
- $500Bn reduction in biodiversity-harmful industry subsidies (primarily agriculture)
Europe
EU Biodiversity Strategy:
- Specific 2030 goals:
- Reduce pesticides use by 50%, fertilizer use by 20%, and antibiotics used in agriculture by 50%Increase the proportion of agricultural land that is organic to 25% (vs. current 75%)
- Convert 10% of agricultural land to ‘high diversity landscape’ to provide space for wild animals, pollinators, and natural pest regulators
- Transform 30% of Europe’s lands and seas into effectively managed protected areas by 2030
EU Deforestation Proposal:
- 2021 draft legislation proposed to require companies to have deforestation-free supply chains for 6 commodities: beef, cocoa, coffee, palm oil, soy, and wood
UK
UK Environment Bill:
- Legally binding target to halt species decline by 2030, described as “the net zero equivalent for nature”
Asia
- In China’s 14th Five Year Plan, biodiversity is referred to via targets to strengthen forestry and wetland protection, increasing wetland protection rates to 55%
- In the NDCs for Nepal, the Philippines, and Bangladesh, forestry management is mentioned
- Philippines mentions focusing on the protection of coastal and marine ecosystems and biodiversity
Appendix 4: Biodiversity Reporting
TNFD (Taskforce for Nature-related Financial Disclosures):
- In the process of development, to steer global financial flows away from nature-negative and into nature-positive outcomes through more robust disclosure requirements
- Akin to the Task Force on Climate Related Financial Disclosures (TCFD), reporting relates to the same four pillars: governance, strategy, risk management, and metrics & targets
- Outputs to be integrated into existing frameworks and standards; not a stand-alone framework
- Will allow for varying levels of disclosure sophistication: basic, intermediary and comprehensive
- Prioritization for reporting
- Industries with the most significant impacts and dependencies on nature
- Within priority industries, most significant nature-related risks and where sufficient data quality is readily available
- Timeline
- June 4, 2021: Taskforce is launched.
- 2022: Plans to test and refine the framework.
- 2023: Official launch of framework.
- Work to date has identified the following key biodiversity risks
- Physical risks: Natural systems are compromised (e.g., degraded soil quality
and marine ecology); could drive rating downgrades and share-price losses or impact balance sheets through direct operations or indirectly through supply chains. - Litigation risks: Emerging legal cases related to nature losses, if parties that suffer losses or damages from environmental change seek compensation from those they hold responsible.
- Transition risks: As policies emerge to protect nature, so do transition risks. Regulatory or market efforts could include abrupt or disorderly introduction
of public policies, technological changes, shifts in consumer or investor sentiment and disruptive business model innovation. Investees could face losses due to sanctions, stranded assets, damages, or inability to secure project financing. - Systemic risks: Risks to the economy as a whole. These risks go beyond nature-related risks for only one sector, such as agriculture, to consider nature-loss risks that could essentially cause a cascade of reactions and economic impacts to which investors and lenders are exposed.
- Physical risks: Natural systems are compromised (e.g., degraded soil quality
SBTN
- Building on progress of SBTi to develop company science-based targets for nature
- 2022: Undertaking corporate engagement to help with the design phase
- 2023: Realistic to assume first targets could be set
EU SFDR: PAIs for Article 8+ include some biodiversity-related metrics
- Activities negatively affecting biodiversity-sensitive areas
- Many other voluntary metrics (of which we would have to pick 2)
SDGs: Specific SDGs that relate to biodiversity
- SDG 2: Zero hunger
- SDG 14: Life below water
- SDG 25: Life on land
Nature Action 100:
A proposal for a Climate Action 100+ for nature; i.e., a collaborative engagement organization for nature


Further information
These materials are intended solely for informational purposes. The views expressed reflect the current views of Pzena Investment Management, LLC (“PIM”) as of the date hereof and are subject to change. PIM is a registered investment adviser registered with the United States Securities and Exchange Commission. PIM does not undertake to advise you of any changes in the views expressed herein. There is no guarantee that any projection, forecast, or opinion in this material will be realized. Past performance is not indicative of future results.
All investments involve risk, including loss of principal. The price of equity securities may rise or fall because of economic or political changes or changes in a company’s financial condition, sometimes rapidly or unpredictably. Investments in foreign securities involve political, economic and currency risks, greater volatility and differences in accounting methods. These risks are greater for investments in Emerging Markets. Investments in small-cap or mid-cap companies involve additional risks such as limited liquidity and greater volatility than larger companies. PIM’s strategies emphasize a “value” style of investing, which targets undervalued companies with characteristics for improved valuations. This style of investing is subject to the risk that the valuations never improve or that returns on “value” securities may not move in tandem with the returns on other styles of investing or the stock market in general.
This document does not constitute a current or past recommendation, an offer, or solicitation of an offer to purchase any securities or provide investment advisory services and should not be construed as such. The information contained herein is general in nature and does not constitute legal, tax, or investment advice. PIM does not make any warranty, express or implied, as to the information’s accuracy or completeness. Prospective investors are encouraged to consult their own professional advisers as to the implications of making an investment in any securities or investment advisory services.
The specific portfolio securities discussed in this presentation are included for illustrative purposes only and were selected based on their ability to help you better understand our investment process. They were selected from securities in one or more of our strategies and were not selected based on performance. They do not represent all of the securities purchased or sold for our client accounts during any particular period, and it should not be assumed that investments in such securities were or will be profitable. PIM is a discretionary investment manager and does not make “recommendations” to buy or sell any securities. There is no assurance that any securities discussed herein remain in our portfolios at the time you receive this presentation or that securities sold have not been repurchased.
For U.K. Investors Only:
This marketing communication is issued by Pzena Investment Management, Limited (“PIM UK”). PIM UK is a limited company registered in England and Wales with registered number 09380422, and its registered office is at 34-37 Liverpool Street, London EC2M 7PP, United Kingdom. PIM UK is an appointed representative of Vittoria & Partners LLP (FRN 709710), which is authorised and regulated by the Financial Conduct Authority (“FCA”). The Pzena documents have been approved by Vittoria & Partners LLP and, in the UK, are only made available to professional clients and eligible counterparties as defined by the FCA.
For EU Investors Only:
This marketing communication is issued by Pzena Investment Management Europe Limited (“PIM Europe”). PIM Europe (No. C457984) is authorised and regulated by the Central Bank of Ireland as a UCITS management company (pursuant to the European Communities (Undertakings for Collective Investment in Transferable Securities) Regulations, 2011, as amended). PIM Europe is registered in Ireland with the Companies Registration Office (No. 699811), with its registered office at Riverside One, Sir John Rogerson’s Quay, Dublin, 2, Ireland. Past performance is not indicative of future results. The value of your investment may go down as well as up, and you may not receive upon redemption the full amount of your original investment. The views and statements contained herein are those of Pzena Investment Management and are based on internal research.
For Australia and New Zealand Investors Only:
This document has been prepared and issued by Pzena Investment Management, LLC (ARBN 108 743 415), a limited liability company (“Pzena”). Pzena is regulated by the Securities and Exchange Commission (SEC) under U.S. laws, which differ from Australian laws. Pzena is exempt from the requirement to hold an Australian financial services license in Australia in accordance with ASIC Corporations (Repeal and Transitional) Instrument 2016/396. Pzena offers financial services in Australia to ‘wholesale clients’ only pursuant to that exemption. This document is not intended to be distributed or passed on, directly or indirectly, to any other class of persons in Australia.
In New Zealand, any offer is limited to ‘wholesale investors’ within the meaning of clause 3(2) of Schedule 1 of the Financial Markets Conduct Act 2013 (‘FMCA’). This document is not to be treated as an offer, and is not capable of acceptance by, any person in New Zealand who is not a Wholesale Investor.
For Jersey Investors Only:
Consent under the Control of Borrowing (Jersey) Order 1958 (the “COBO” Order) has not been obtained for the circulation of this document. Accordingly, the offer that is the subject of this document may only be made in Jersey where the offer is valid in the United Kingdom or Guernsey and is circulated in Jersey only to persons similar to those to whom, and in a manner similar to that in which, it is for the time being circulated in the United Kingdom, or Guernsey, as the case may be. The directors may, but are not obliged to, apply for such consent in the future. The services and/or products discussed herein are only suitable for sophisticated investors who understand the risks involved. Neither Pzena Investment Management, Ltd. nor Pzena Investment Management, LLC nor the activities of any functionary with regard to either Pzena Investment Management, Ltd. or Pzena Investment Management, LLC are subject to the provisions of the Financial Services (Jersey) Law 1998.Management, Ltd. or Pzena Investment Management, LLC are subject to the provisions of the Financial Services (Jersey) Law 1998.
For South African Investors Only:
Pzena Investment Management, LLC is an authorised financial services provider licensed by the South African Financial Sector Conduct Authority (licence nr: 49029).
© Pzena Investment Management, LLC, 2023. All rights reserved.