


The Small Cap Value Opportunity
10 min read

In 1992, academics Eugene Fama and Kenneth French unveiled their renowned three-factor stock return model, which included as one of the key variables the small-cap effect – specifically, that shares of smaller companies should outperform those of larger companies over the long term. Since the Global Financial Crisis (GFC), small caps have underperformed large caps by 285 basis points per annum1; however, we do not consider today’s performance disparity to be the new normal. We believe alpha-seeking investors should look to structurally profitable, cash-generating small-cap value stocks, with higher expected earnings growth and far cheaper valuations than overbought large caps.
THE FUNDAMENTAL CASE
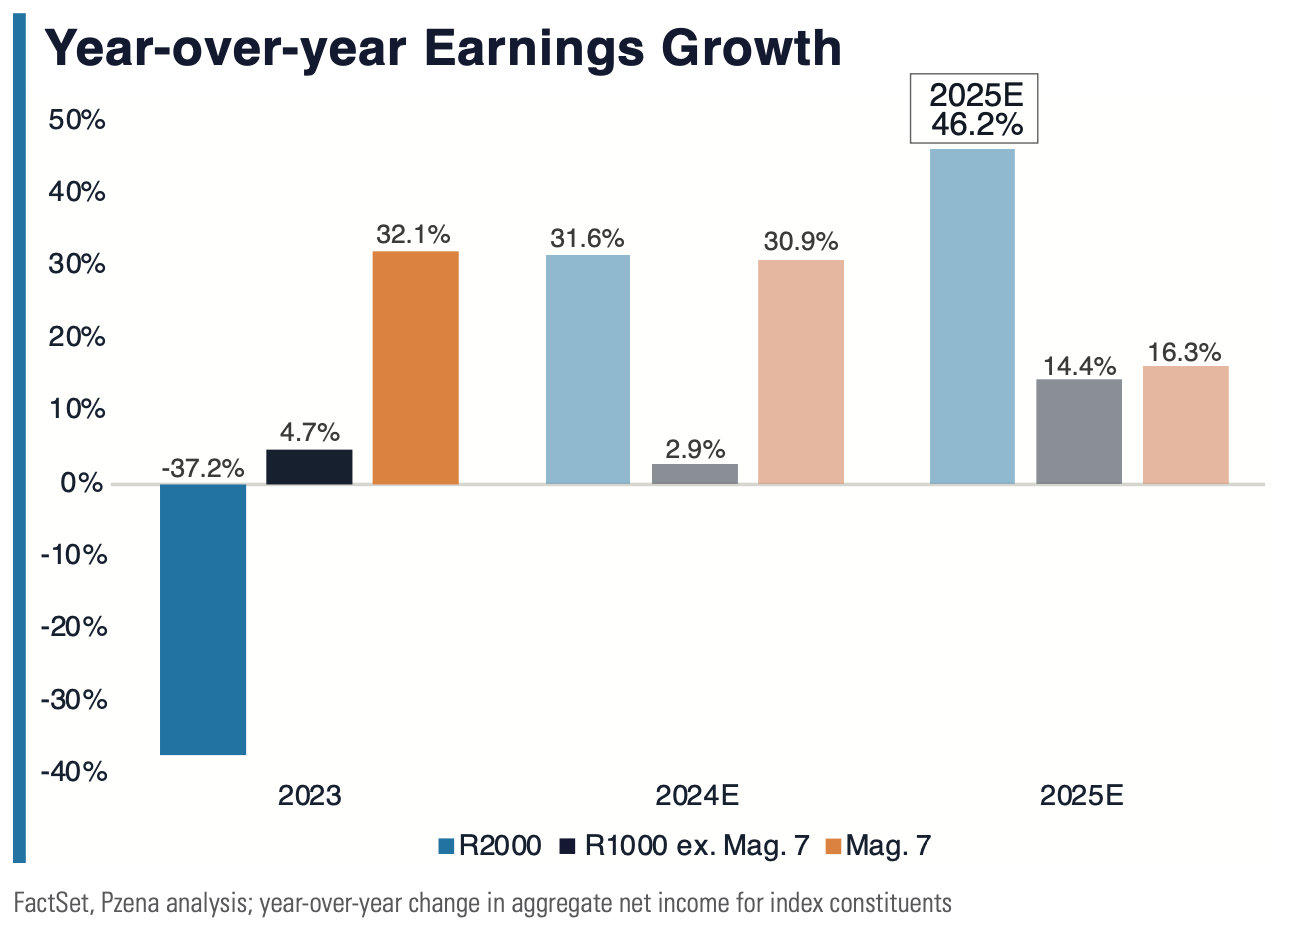
We believe small caps are more attractive from an income statement and balance sheet perspective than the market is acknowledging. The so-called Magnificent 7, and consequently the S&P 500®, had nothing short of a magnificent run, but we believe the type of earnings growth that propelled them higher is moderating, whereas small caps’ earnings are spring-loaded.
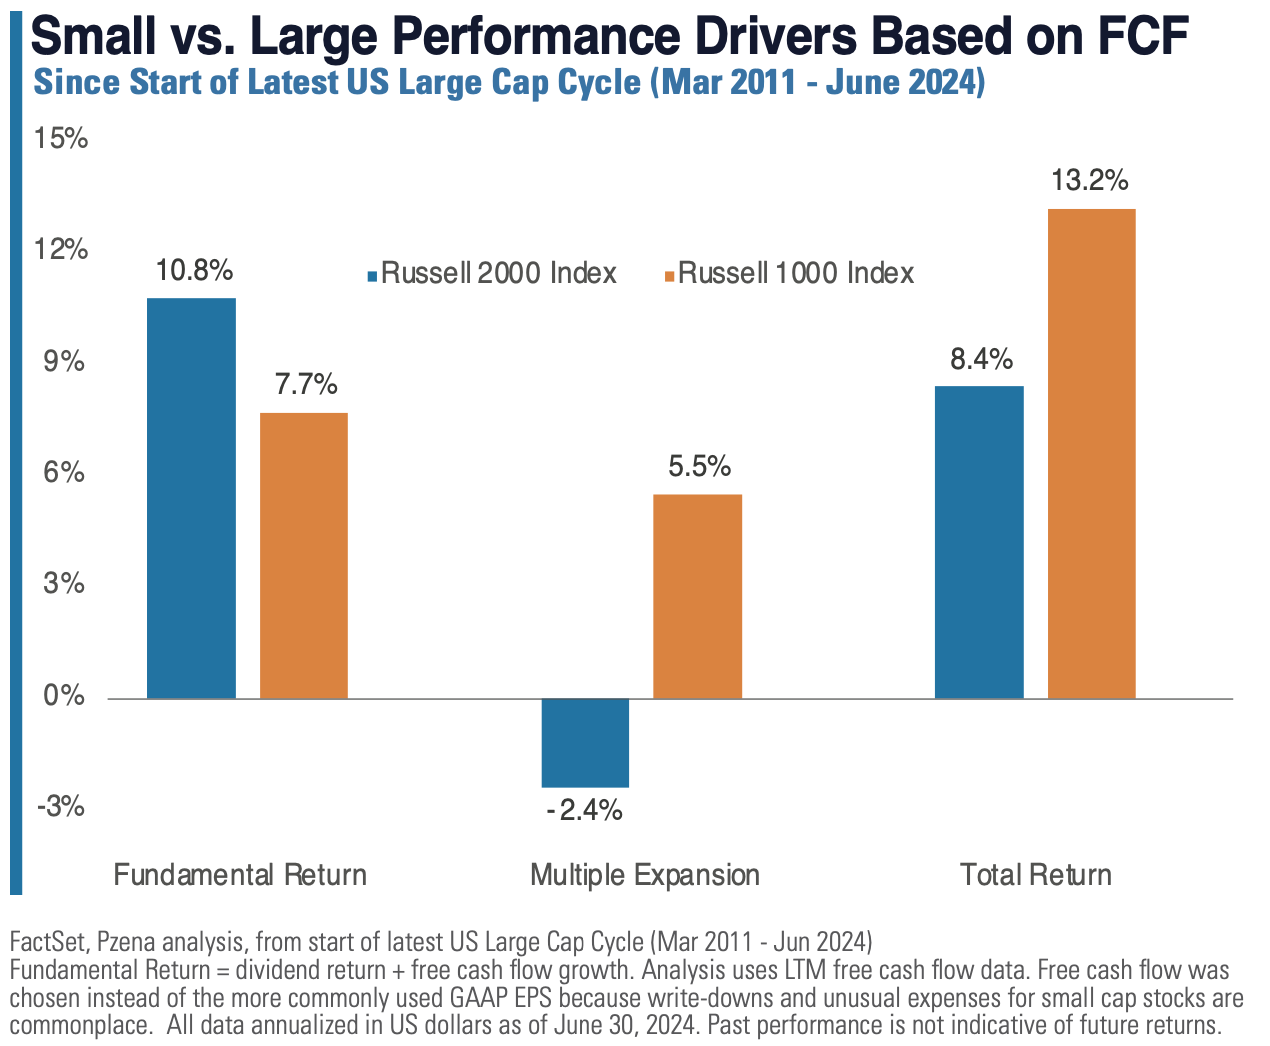
Valuation multiples fluctuate in the short term, but over time, stock prices tend to track earnings growth. Interestingly, since 2011, Russell 2000® Index companies have delivered faster free cash flow (FCF) growth than their Russell 1000® Index peers, yet their multiples have contracted. We don’t believe this is sustainable over the long run; we believe it’s a matter of when, not if, small-cap stocks will regain leadership.
From a balance sheet perspective, smaller companies are generally more indebted than mega-cap corporations. But, as always, the devil is in the details. Excluding financial companies, which have inherently leveraged business models, nearly 50% of the Russell 2000 Index’s $863bn in net debt is concentrated in just 74 companies (none of which we currently own), representing 7.6% of the index’s non-financial market cap2.
Small caps also have relatively more floating rate debt, and their interest coverage ratios have therefore fallen in recent quarters amid the Fed’s rate hikes. However, as rates eventually moderate, that relative headwind will start to become a tailwind. Indeed, the Russell 2000 Index’s interest coverage ratio3 was 2.6x in 2Q22, just before the Fed began raising rates; today, that coverage has declined to 1.7x4. Our portfolio’s non-financial interest coverage ratio is approximately 3x today and is expected to rise to 5.6x by 20255, as earnings grow while interest costs normalize.
UNEARTHING SMALL CAPS’ RETURNS
Small-cap skeptics often note that the Russell 2000 Index is full of unprofitable companies – and they are not wrong. Approximately 43% of Russell 2000 constituents posted negative net income over the past year, compared to just 13% of Russell 1000 companies. But nearly a quarter of the Russell 2000 loss-making names are biotech companies, which are not necessarily expected to be profitable6. Interestingly, the 2025 FCF yields of the two indices are currently identical at 4.5%7. Still, it pays to be selective with small caps – to pick the most attractively valued names with high structural profitability.
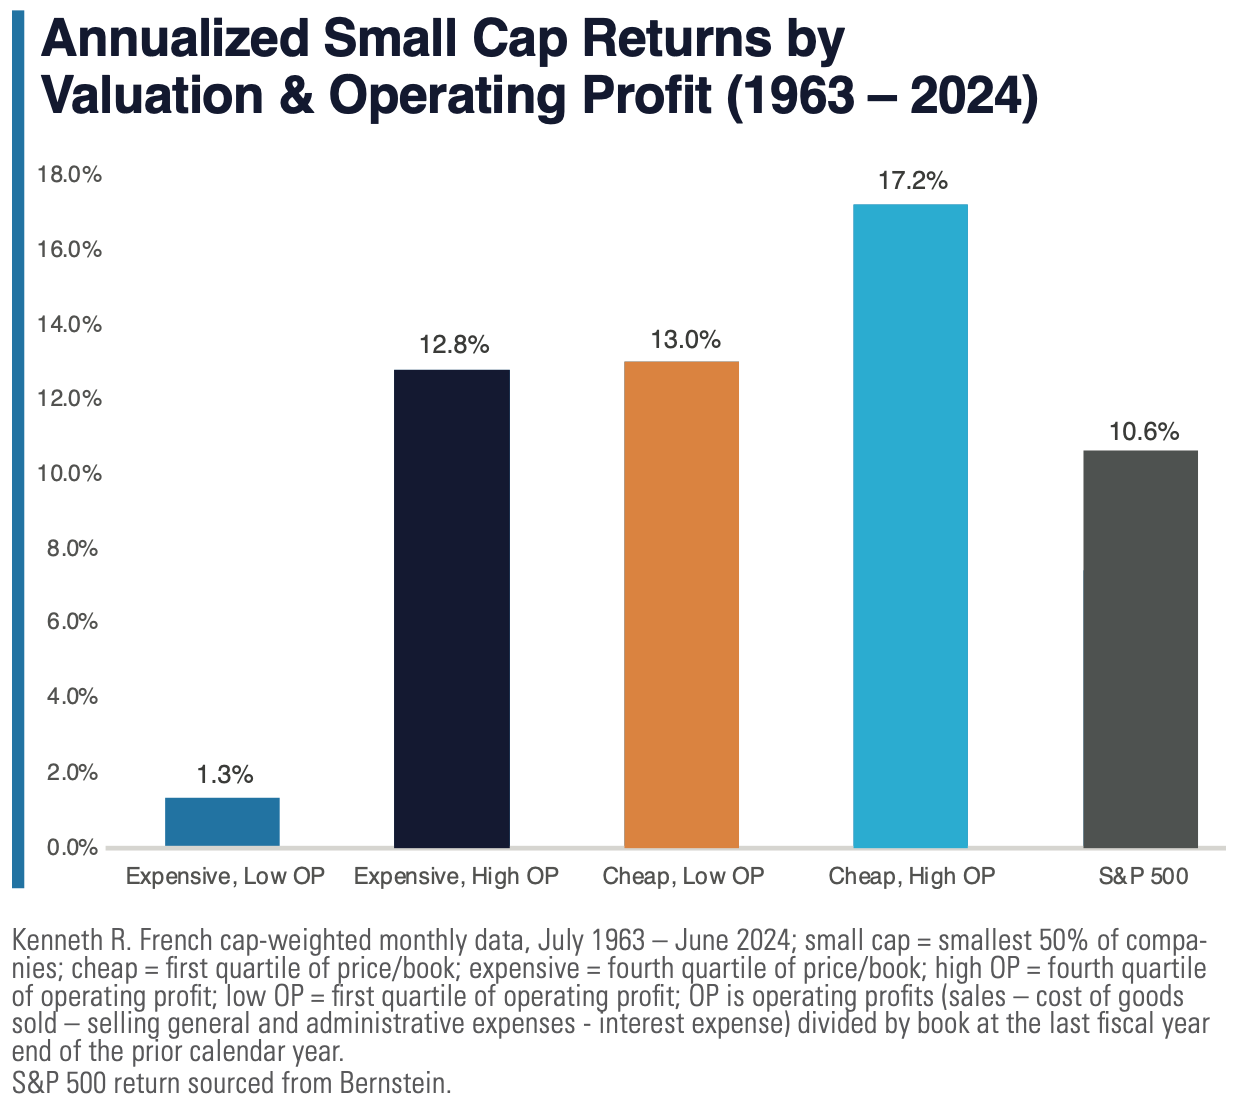
We believe the highest long-term returns are available to investors who sift through the small-cap universe and buy the cheapest names with the best fundamentals. The caveat is that these companies aren’t necessarily in plain sight. A skilled active manager must uncover these names before their solid financial metrics are reflected in their valuations.
Below, we highlight a few of the Pzena Small Cap Focused Value portfolio metrics:
- Ninety-six percent of our portfolio companies were profitable on a net income basis over the latest fiscal year, with only two names expected to be loss-making for FY241.
- The portfolio’s median forward earnings multiple is 13.7x; this compares to 15.0x for the Russell 2000 Value Index, 16.9x for the broad Russell 2000, and 20.3x for the S&P 5001.
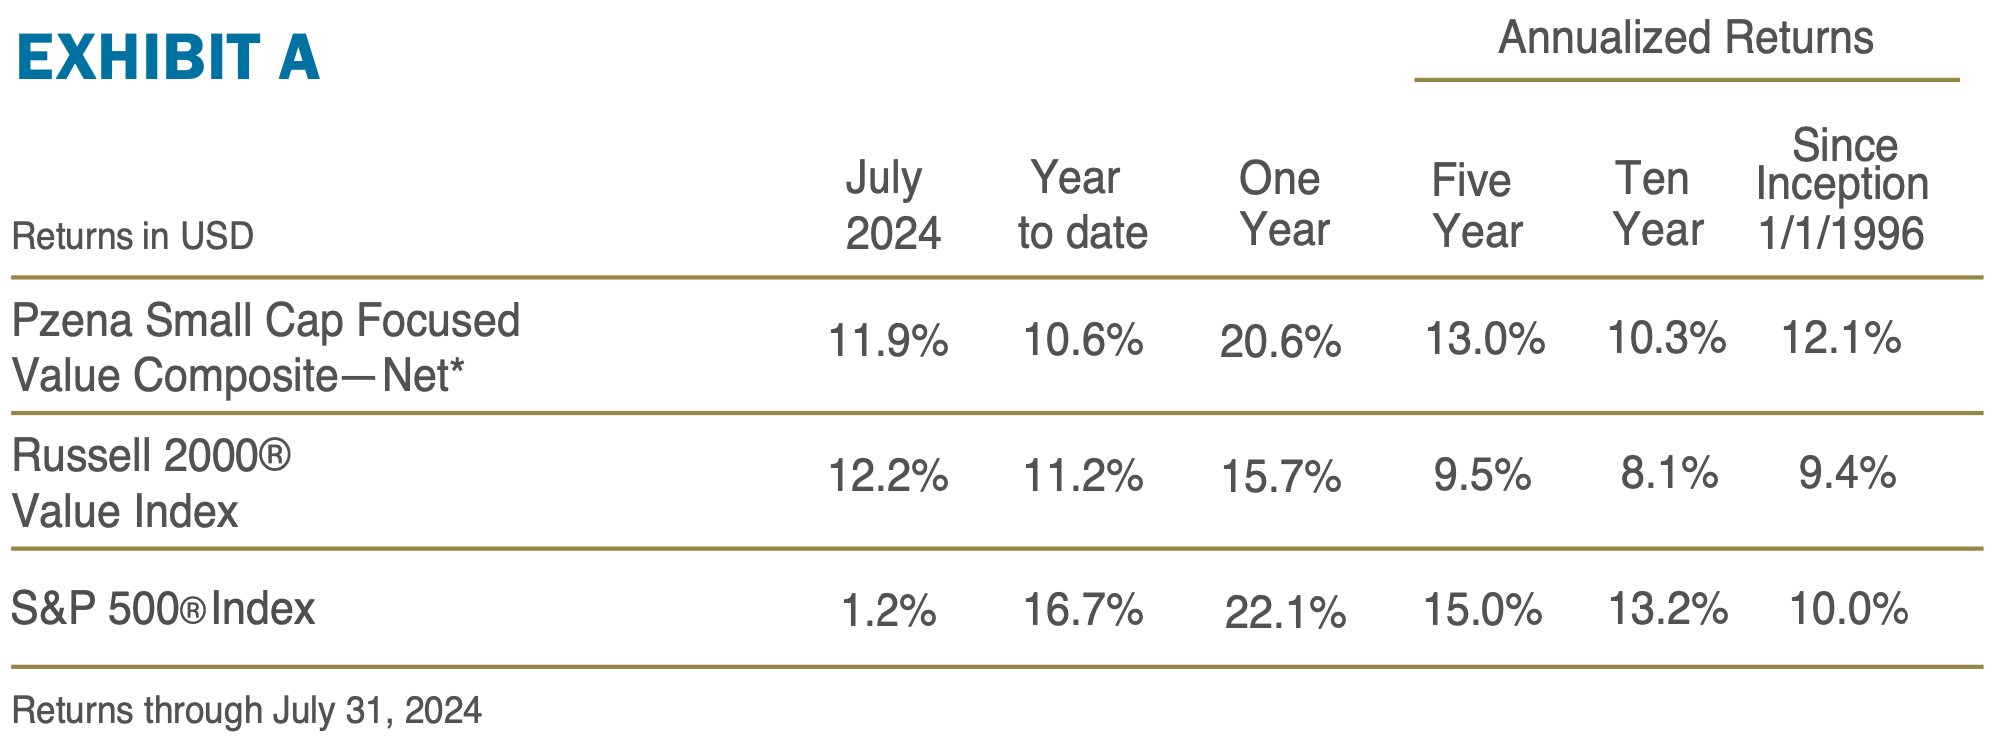
- Since its 1996 inception, the strategy has outperformed the S&P 500 by 206 basis points per annum, as well as its Russell 2000 Value benchmark by 265 basis points per annum, both net of fees. (See Exhibit A on page 3)
BREAKING DOWN SMALL CAPS’ LOST DECADE
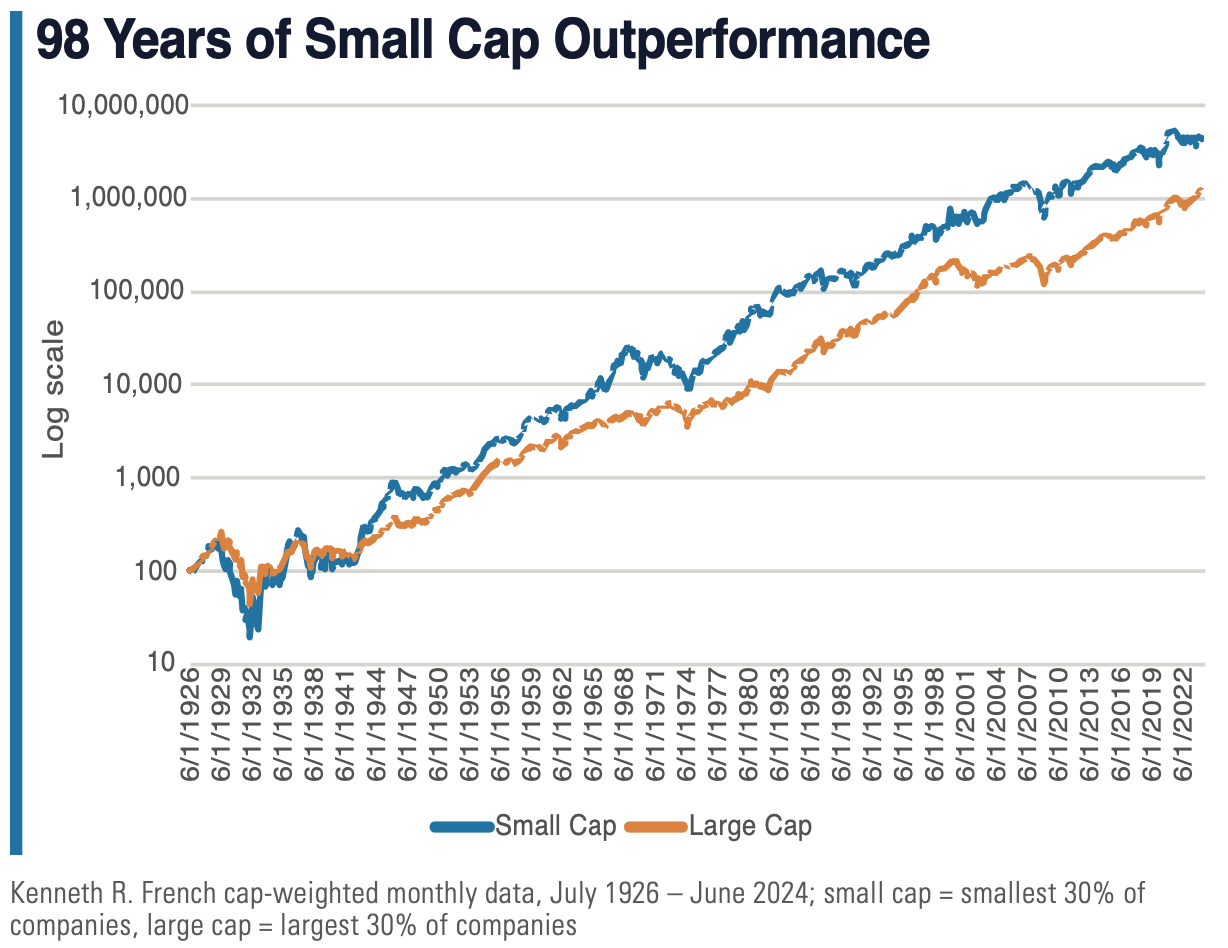
While far from spectacular, small caps’ 6.7% annual return over the past decade is hardly a disaster, and only looks deficient when compared to large caps’ stellar 13.2% print. None of the various explanations for the performance delta make a convincing case that smaller, higher beta, less informationally efficient stocks are somehow less attractive today than they have been throughout history. And that historical performance advantage is material: 142 basis points per annum over the past 98 years.
The initial post-GFC recovery was characterized by slow growth and ultracheap financing – an environment conducive to venture capital and public growth investing. Nonetheless, cheap, small-cap stocks held their own, benefitting from the domestic economic recovery and 2016 post-election reflation trade.
The US economy continued to expand into 2017/18, but the volatile period was largely mired in global trade wars, rising interest rates, and recession concerns. This uncertainty led investors to perceived safety stocks – namely, expensive growth companies expected to deliver steady earnings regardless of the economic backdrop. From there, the valuation gap exploded. Following their historic drawdown in 2022, mega-cap growth stocks regained the ascendency on enthusiasm over AI, while higher-for-longer rates benefitted the biggest companies, given their huge piles of cash and mostly fixed-rate debt.
Although the performance of small and large caps really started to diverge around 2018, market pundits have primarily focused on the last decade of activity. Small-cap bears have plenty of ammunition; the large cap performance advantage is 640 basis points per annum over the past 10 years. That’s clearly material, but how does it compare to history? Though rare, rolling 10-year periods (monthly intervals) of large cap dominance have occurred before, and we’ve witnessed worse periods – 24 of them, between 1926 and 2024, to be precise.
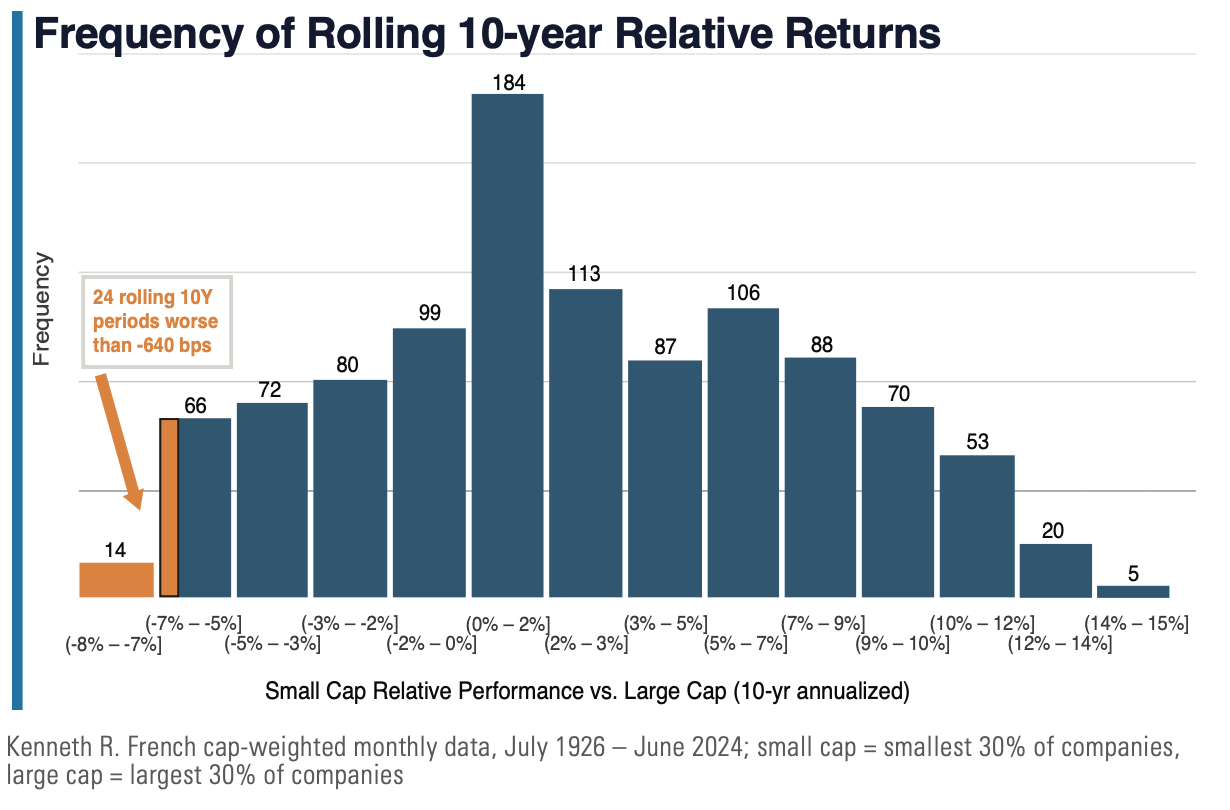 Each of these 24 periods occurred in the 1990s, when the “small cap is dead” calls were as ubiquitous as they are today. That was immediately before the Russell 2000 Index outpaced the 1000 series by 42 percentage points over the decade following the dot-com peak8.
The key takeaway is not when and by how much small caps have underperformed historically, but how the cohort performed following these rare periods. Of the 2329 rolling 10-year periods between 1926 and 2014, in which small caps underperformed their large caps peers, their fortunes reversed 86% of the time over the subsequent decade, and the average small cap outperformance for all 232 periods was 420 basis points per annum.
CONCLUSION
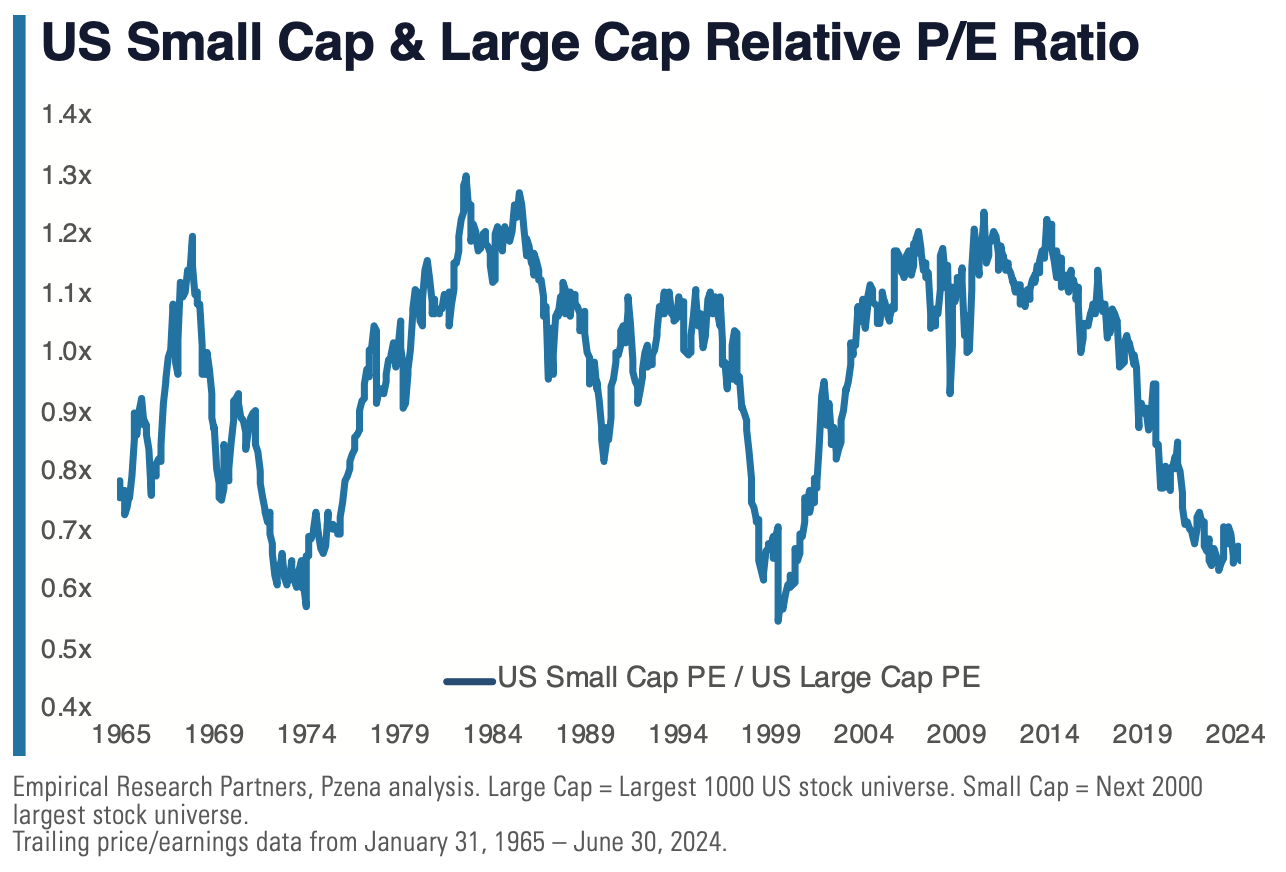
The multi-year, extreme multiple expansion of US large caps has manifested in a small-cap relative valuation discount approaching the 1974 Nifty Fifty trough level, which occurred just before small caps trounced large caps by nearly 13 percentage points10 per year over the subsequent decade.
We believe the conditions exist for US small caps to experience a powerful and sustained rotation, and our concentrated portfolio of structurally profitable businesses, trading at a discount of over 30% to the market, with higher expected earnings growth, is poised to disproportionally benefit from a changing of the guard.
1. Kenneth R. French cap-weighted monthly data, Feb. 2009 – June 2024; small caps = smallest 30% of companies, large caps = largest 30% of companies
2. FactSet, Pzena analysis
3. Operating profit / interest expense
4. FactSet
5. FactSet, Pzena analysis of median interest coverage ratios
6. FactSet, Pzena analysis
7. FactSet as of July 2024
8. Russell 2000 vs. 1000, TR August 2000 – August 2010
9. July 1926 – June 2014 (the limit of 10-year forward return calculations)
10. Kenneth R. French cap-weighted monthly data, Dec. 1974 – Dec. 1984; small cap = smallest 30% of companies, large cap = largest 30% of companies
Past Performance is not indicative of future results.
Net Returns are derived using a model fee applied monthly to Gross returns. Pzena uses the highest tier fee schedule, excluding performance fees, to illustrate the impact of fees on performance returns. As product fees change, the current highest tier schedule will be in effect.
Returns could be impacted, positively or negatively, by currency fluctuations, where applicable.
Gross rates of return are presented gross of investment management fees and net of the deduction of transaction costs. An investor’s actual return will be reduced by investment management fees. Net Returns are derived using a model fee applied monthly to Gross returns. Pzena uses the highest tier fee schedule, excluding performance fees, to illustrate the impact of fees on performance returns. As product fees change, the current highest tier schedule will be in effect.
“US small caps are trading at their cheapest valuations relative to large caps in nearly twenty-four years, resulting in what we believe is an attractive opportunity for investors to boost exposure to financially stable, small cap value stocks, that are projected to grow earnings at a faster rate than their large cap peers. ”


FURTHER INFORMATION
This document is intended solely for informational purposes. The views expressed reflect the current views of Pzena Investment Management (“PIM”) as of the date hereof and are subject to change. PIM is a registered investment adviser registered with the United States Securities and Exchange Commission. PIM does not undertake to advise you of any changes in the views expressed herein. There is no guarantee that any projection, forecast, or opinion in this material will be realized. Past performance is not indicative of future results. All investments involve risk, including risk of total loss.
This document does not constitute a current or past recommendation, an offer, or solicitation of an offer to purchase any securities or provide investment advisory services and should not be construed as such. The information contained herein is general in nature and does not constitute legal, tax, or investment advice. PIM does not make any warranty, express or implied, as to the information’s accuracy or completeness. Prospective investors are encouraged to consult their own professional advisers as to the implications of making an investment in any securities or investment advisory services.
All investments involve risk, including loss of principal. The price of equity securities may rise or fall because of economic or political changes or changes in a company’s financial condition, sometimes rapidly or unpredictably. Investments in foreign securities involve political, economic and currency risks, greater volatility and differences in accounting methods. These risks are greater for investments in Emerging Markets. Investments in small-cap or mid-cap companies involve additional risks such as limited liquidity and greater volatility than larger companies. PIM’s strategies emphasize a “value” style of investing, which targets undervalued companies with characteristics for improved valuations. This style of investing is subject to the risk that the valuations never improve or that returns on “value” securities may not move in tandem with the returns on other styles of investing or the stock market in general.
The Russell 2000® Value Index measures the performance of small-cap value segment of the US equity universe. It includes those Russell 2000® companies with lower price-to-book ratios and lower forecasted growth values. The S&P 500® Index seeks to track the performance of an index composed of 500 large-cap U.S. companies. These indices cannot be invested in directly.
For UK Investors: This marketing communication is issued by Pzena Investment Management, Limited (“PIM UK”). PIM UK is a limited company registered in England and Wales with registered number 09380422, and its registered office is at 34-37 Liverpool Street, London EC2M 7PP, United Kingdom. PIM UK is an appointed representative of Vittoria & Partners LLP (FRN 709710), which is authorised and regulated by the Financial Conduct Authority (“FCA”). The Pzena documents have been approved by Vittoria & Partners LLP and, in the UK, are only made available to professional clients and eligible counterparties as defined by the FCA. Past performance is not indicative of future results. The value of your investment may go down as well as up, and you may not receive upon redemption the full amount of your original investment. The views and statements contained herein are those of Pzena Investment Management and are based on internal research.
For Jersey Investors Only: Consent under the Control of Borrowing (Jersey) Order 1958 (the “COBO” Order) has not been obtained for the circulation of this document. Accordingly, the offer that is the subject of this document may only be made in Jersey where the offer is valid in the United Kingdom or Guernsey and is circulated in Jersey only to persons similar to those to whom, and in a manner similar to that in which, it is for the time being circulated in the United Kingdom, or Guernsey, as the case may be. The directors may, but are not obliged to, apply for such consent in the future. The services and/or products discussed herein are only suitable for sophisticated investors who understand the risks involved. Neither Pzena Investment Management, Ltd. nor Pzena Investment Management, LLC nor the activities of any functionary with regard to either Pzena Investment Management, Ltd. or Pzena Investment Management, LLC are subject to the provisions of the Financial Services (Jersey) Law 1998.
For EU Investors Only: This marketing communication is issued by Pzena Investment Management Europe Limited (“PIM Europe”). PIM Europe (No. C457984) is authorised and regulated by the Central Bank of Ireland as a UCITS management company (pursuant to the European Communities (Undertakings for Collective Investment in Transferable Securities) Regulations, 2011, as amended). PIM Europe is registered in Ireland with the Companies Registration Office (No. 699811), with its registered office at Riverside One, Sir John Rogerson’s Quay, Dublin, 2, Ireland. Past performance is not indicative of future results. The value of your investment may go down as well as up, and you may not receive upon redemption the full amount of your original investment. The views and statements contained herein are those of Pzena Investment Management and are based on internal research.
For Australia and New Zealand Investors Only: This document has been prepared and issued by Pzena Investment Management, LLC (ARBN 108 743 415), a limited liability company (“Pzena”). Pzena is regulated by the Securities and Exchange Commission (SEC) under U.S. laws, which differ from Australian laws. Pzena is exempt from the requirement to hold an Australian financial services license in Australia in accordance with ASIC Corporations (Repeal and Transitional) Instrument 2016/396. Pzena offers financial services in Australia to ‘wholesale clients’ only pursuant to that exemption. This document is not intended to be distributed or passed on, directly or indirectly, to any other class of persons in Australia. In New Zealand, any offer is limited to ‘wholesale investors’ within the meaning of clause 3(2) of Schedule 1 of the Financial Markets Conduct Act 2013 (‘FMCA’). This document is not to be treated as an offer, and is not capable of acceptance by, any person in New Zealand who is not a Wholesale Investor.
For South African Investors Only: Pzena Investment Management, LLC is an authorised financial services provider licensed by the South African Financial Sector Conduct Authority (licence nr: 49029).